From trajectory to solution: data and metrics
Tracking by itself does not bring money — it brings decisions that are made on it. We analyze the session data model, metrics that really change the manager's behavior, why a heat map without normalization is useless, how to measure the implementation effect without fictitious numbers, and where integrations with 1C, cash register and locks break down.
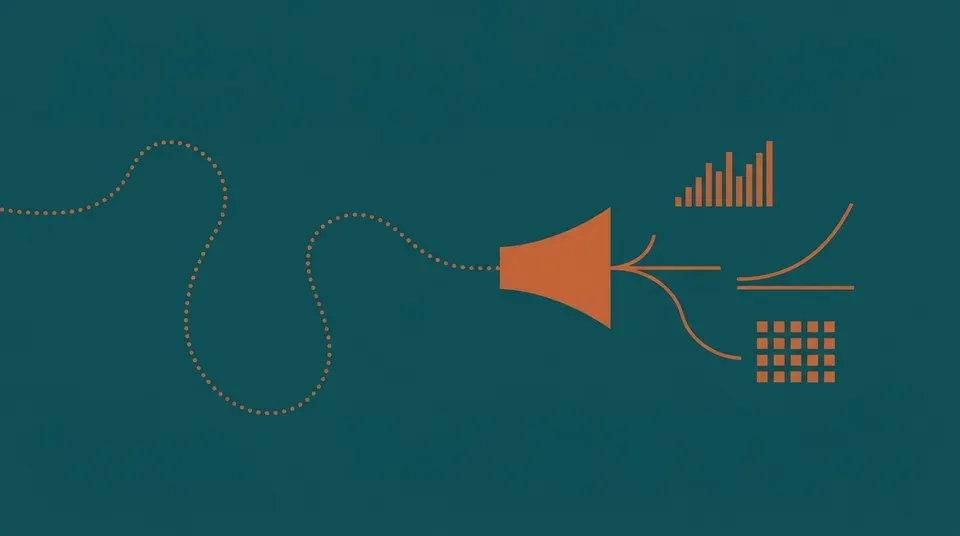
The most frequent fate of the movement tracking project looks like this. The equipment is installed, the system is working, the contractor has handed over the object, a section with graphs has appeared in the admin panel. The manager opened it twice: at the demonstration and a week later. Six months later, when discussing the budget, someone asks why we bought it, and there is no clear answer.
At the same time, the equipment is working properly. Data is collected. The problem is not in the sensors.
This article is about the section between "the system sees the guest" and "we have made a decision." It's not about hardware, but about a data model, a set of metrics, the order of measuring the effect and integration with the accounting system. And it is he who determines whether everything else will pay off.
Data model: five entities from which everything is assembled
You need to start not with reports, but with what is stored. It is more expensive to redo the data model in a year than to design it right away.
| Essence | What is it | From where | Why |
|---|---|---|---|
| Event | Fact with time and place: bracelet mark, zone entry, purchase, alarm | Reader, lock, cash register, sensor | The basis for money and accounting: an indisputable fact |
| Session in the zone | The interval of being in the zone with the beginning and end | A pair of events or a continuous channel | Time in the zone, loading |
| Transition | Pair "Zone A → zone B" with time | Session sequence | Routes, funnel, congestion |
| Visit | Everything that happened between the issuance of the bracelet and its return | Gluing events by ID | Unit of analysis and calculations |
| Trajectory | A sequence of coordinates with confidence labels | Continuous channel | Heat maps, detailed analytics |
Four rules that should be laid down right away.
Raw events must be stored. Aggregates can be counted from events; events from aggregates cannot. Any system that gives only ready-made reports will deprive you of the opportunity to ask a new question in a year. Requirement for the supplier: uploading raw events via the API or to the database, and this is a clause of the agreement.
Single session ID. One key that connects the marks of the bracelet, purchases at the checkout, locker openings, alarms and zone sessions. Without it, you don't have a system, but four unrelated logs.
Single time. The banality that breaks projects: the reader, cash register, video server and sensors must be synchronized using a single time source. The discrepancy of one and a half minutes between the ticket office and the turnstile turns the analysis of "what the guest bought after entering the zone" into guessing.
Directory of zones — one. Zones in the access system, in video analytics, in sensors and in reports should be named the same and match the boundaries. This is the most boring and most useful work in the project.
Metrics: what to count and what to do about it
The main rule is: everything is a relation, and the flow is in the denominator
Almost any meaningful metric is a fraction with the number of people in its denominator. Therefore, accurate counting at the input is not one of the functions of the system, but the foundation of all other metrics. Conversion, zone attendance, revenue per guest — everything loses its meaning if the denominator is inaccurate or unstable.
Hence the practical priority: first, the correct score on the inputs, then everything else. This also explains why the counter in the opening is more important than it seems, and why an unstable source like Wi-Fi is dangerous — it spoils not one metric, but everything.
Working set of metrics
| Yandex.Metrica | How is it considered | Source | What are they doing to her |
|---|---|---|---|
| Flow by hour and day | Number of inputs per interval | Counter, turnstile | Shift schedules, time rates, opening hours |
| Input bandwidth | A person per minute at the peak, the time of registration | Ticket office and turnstile | Number of jobs at the reception, self-service terminals |
| Queue time | The difference between coming to the reception area and issuing a bracelet | Zone counter plus cash register | The decision on staffing or self-service |
| The proportion of those who reached the main service | Those who passed the wet zone turnstile to those who entered | Events | Diagnostics: the guest comes in and does not get there — the problem is in the locker room or navigation |
| Zone loading | The number of people in the zone by time | Zone or event sensor | Staff placement, capacity, cleaning |
| Time in the zone | Session duration | Session | Understanding the value of the zone |
| Zone conversion to purchase | Point-of-sale purchases to zone visits | Session plus cash register | Rearrangement of points of sale, assortment, price |
| Time until the first purchase | From the entrance to the first receipt | Events and cash register | Assessment of barriers: far away, unclear, no reason |
| Turnover of lockers | Full-time employment, the proportion of people employed at part-time | Locks | Number of lockers, "one guest — one locker" policy |
| Route chains | Frequent zone sequences | Transitions | Understanding typical session scenarios |
| Session processing | Percentage of sessions over the tariff, amount of surcharges | Events and terminal | Tariff schedule, policy of surcharges |
| Loading hot zones | Simultaneity and queue at the steam room | Sensors plus events | Hovering schedule, number of bath attendants |
Corridor and destination
A simple rule for reading zone data that saves you from a typical mistake: watch visits along with time. An area with a large number of visits and a very short time is a corridor, not a destination. Trying to "add value" to the corridor is pointless: they just walk along it.
What is not necessary to measure
Metrics that look nice and do not lead to any solution: "average route", "total number of movements", "average speed of the guest", "percentage of territory coverage". If there is no answer to the question "what will we do if this figure changes by twenty percent", the metric does not need to be calculated and displayed.
Heat map: beautiful and usually useless
The heat map is the main exhibit of any presentation and the most frequent source of incorrect conclusions.
The problem. The map shows the absolute intensity: where people have been more often. But the intensity at the entrance, in the aisles and at the stairs will always be high, because everyone passes through these places. As a result, the map draws your layout, not the behavior of guests.
What to do is to normalize. There are three options, and it's better to use everything:
- To the input stream. The intensity is divided by the number of guests for the same period. So the maps of different days become comparable, and a change in behavior is visible, not a change in attendance.
- To the square. The density of people per square meter, not the sum of hits per cell. Otherwise, large areas are always "hot".
- By time. Separate maps for specific periods: weekday morning, Friday evening, Saturday peak. The monthly average map does not describe any real mode of operation.
How to read correctly. The map does not answer the question "where it is crowded", but the question "where it is more crowded than it should be with such a layout and such a flow." It is the deviation from the expected that is useful information: congestion in an unexpected place, an empty zone with a high total load, congestion at one of several identical points.
And an honest reservation about the source. If the heat map is based on video analytics, its resolution is limited by the actual tracking accuracy; if it is based on zonal sensors, it is not a map, but a histogram by zone, and you should not call it a map so as not to create false expectations.
What they do with the data: Wednesday solutions
A metric without a solution is a decoration. Specific bundles that work.
Thermal spa complex and sauna.
- the schedule of bath attendants is based on the actual loading of the steam area, and not on a flat grid;
- the time of hovering, arranged according to peaks, and not according to the convenience of the staff;
- cleaning of showers on the aisle counter — after a certain number, not every two hours;
- deciding on the number of lockers by turnover, not by the number of guests;
- weekend tariff and "quiet hours" — according to the real distribution of the flow;
- rearranging points of sale by zone conversion, not by intuition.
Water park.
- distribution of rescuers by loading zones in time;
- roller coaster capacity and queue management;
- control of the capacity of the bowl according to the norms of the area per person;
- the time and causes of congestion at the entrance group on peak days.
Fitness club.
- the schedule of classes is based on the actual attendance of the halls, not by appointment;
- decision on additional equipment for loading zones during peak hours;
- evaluation of the effect of promotions based on the increase in visits, and not on sold subscriptions.
Shopping mall and HoReCa.
- rental solutions for passability and conversion of zones;
- the placement of staff on the food court by peaks;
- assessment of the effect of measures to increase the flow with normalization for weather and day of the week.
Production and warehouse.
- time on sites and comparison of shifts;
- bottlenecks along the routes of equipment;
- Labor protection: stay in hazardous areas.
How to measure the effect without fictitious numbers
The most common question at the start is: "how much will it bring". The most frequent market response is a figure from someone else's case. You can't do that, and that's how you can do it.
Step 1. Basic measurement before changes. At least two to four weeks of data collection, in which nothing specifically changes. This is your starting point. By skipping this step, you lose the opportunity to prove something - and that's why it is skipped most often.
Step 2. One change at a time. Rearranged the bar, added a bath attendant, changed the tariff. Two changes at the same time — and the result is not attributed.
Step 3. Control. Three ways, in ascending order of reliability:
- comparable period: the same week a month ago, adjusted for season, weather, holidays. Weak but accessible control;
- control zone: we change one of the two similar zones, the second one remains as it is. Good control;
- shift control: we alternate the mode of work by shifts or days of the week. The best control available in the service business.
Step 4. Count in money or in transactions. Not "the time in the zone has increased by 12%", but "the bar's revenue per guest has increased from X to Y" or "the check-in time at the entrance has decreased from A to B, the queue at the peak has disappeared."
Step 5. Check if the result is explained differently. Attendance has increased — maybe it's just getting colder. This is the main reason why control is needed.
And about other people's numbers. In the materials of vendors, there are statements like an increase in guest spending by tens of percent when switching to a non-cash bracelet. Such figures are published without methodology and without control; they may be true for that object and say nothing about yours. Industry benchmarks are useful as context, but the goal is always set from its own baseline.
Where data and reports live
An accounting database for your data model, a website with CRM applications, an online record and terminals are all in one loop.
The accounting database for your data
A web database for accounting that has outgrown Excel, but does not fit the standard program: contracts, objects, rights, counterparties and relationships between them. Fields and relationships are described by the setting, so we quickly assemble the database for your process and refine it without rewriting.
Request a KPCorporate website with CRM applications and chat
The company's website has its own admin panel: pages are assembled from ready-made blocks, applications from the form, chat, Telegram and mail get into one CRM, managers respond to visitors in real time. Three languages with automatic translation and tools for SEO and 152-FZ.
Request a KPOnline registration and payment from the site in 1C:Fitness
Recording and payment from the site themselves fall into 1C:Fitness, and the client sees the current schedule and subscription status in his personal account. The site, recording and accounting work as one system, applications are no longer transferred manually.
Request a KPSelf-service terminal with 1C:Fitness
The terminal at the reception takes care of typical operations: purchase and renewal of the subscription and the arrival mark. The data immediately goes to 1C:Fitness, so the administrator does not need to enter them manually, and there is no queue at the counter.
Request a KPStorage and depersonalization as an engineering task
The legal side is discussed in the next article; here — engineering.
The main idea is to separate the accounting contour and the analytics contour. In the accounting circuit, the guest is connected to the contract, money and claims are considered there, the shelf life is determined by accounting and legal requirements. There is no guest in the analytical contour — there is a session with an impersonal identifier, zones, time and amounts without reference to the person.
| Data | In what form | A reasonable time | Note |
|---|---|---|---|
| Raw events with the bracelet ID | As it is | Short: weeks — months | They are needed for reviewing claims and recalculations |
| The "guest bracelet" bundle | Separately, with limited access | By accounting necessity | Breaks at the expiration of the term |
| Sessions are impersonal | Aggregate at the session level | Years | The basis of analytics over a long period of time |
| Aggregates by hour and zone | Numbers without identifiers | Indefinitely | They don't contain anything personal |
| Video Archive | Recording | According to the regulations of the facility | The heaviest and most sensitive array |
| Incident records | Dedicated storage | Longer than the usual archive | Evidence base |
Two technical requirements that need to be put into the system right away, otherwise they will have to be embedded later:
The procedure of depersonalization. Automatic removal of a bundle on a schedule, not manually. If it is done by hands, it is not done.
Execution of the subject's request. The guest has the right to request information and deletion. The system should be able to find everything one person at a time and delete it without destroying the units. Therefore, aggregates should be depersonalized by construction, and not calculated every time from personal events.
Integrations: Where everything breaks down
The most underrated part of the project. Below are the real bounce points.
Accounting system (1C and 1C:Fitness). The tariff, access rights, subscription, and client come from it; visits, surcharges, and sales go there. Typical problems: different directories of services and zones, time discrepancy, lack of idempotency (resending creates a second session), asynchrony — the bracelet has been issued, but the rights have not yet arrived.
Cash register and fiscal registrar. Buying a bracelet is a key link for zone conversion. Problem: there is a receipt, there is no link to the session, and it is impossible to restore it later. The solution is laid before the launch: the session number in the receipt or in the sales system.
Locker locks. The cheapest source of data about what the guest is doing, and most often unconnected. Problems: offline locks without a network do not give events; the "master key opened everything" scheme breaks statistics.
Access system and turnstiles. The source of the main denominator. Problem: emergency opening and manual passes are not recorded as passes, and a gap appears in the data — this should at least be logged as a special event.
CRM and messengers. Scenarios "the guest did not reach the zone — offer to try", "the guest has not been for three months — remind". This is where the area where marketing consent is required begins, and the rules for mailing over telecommunication networks are stricter than it seems.
Reporting and BI. We need one layer in which the metrics are uniquely defined. If attendance is counted by three different systems, a dispute about the "correct figure" is inevitable; this is removed by assigning the main source for each metric and fixing the definitions in the document.
An integration rule that saves months. The exchange is designed as a stream of events with confirmation and the possibility of resending, and not as an overnight upload of files. Otherwise, any communication failure leaves a hole, which is then filled in manually.
Operation: so that in a year it still works
Responsible with a name. The system must have an owner — a person who looks at the reports and is responsible for their reliability. Without this, the data degrades silently.
Monitoring of sensors. The system is obliged to report a silent sensor. A sign of a good project: there is a hardware status screen, and someone is looking at it.
Reliability control. Once a month — reconciliation of two independent sources (turnstile and counter, bracelet events and cash register). The discrepancy is greater than the threshold — a reason to understand, not to adjust.
Repeated measurement of accuracy. Three to six months after acceptance, according to the same protocol (see the methodological article). The situation is changing, the accuracy is drifting.
Rules of changes. Rearranged the equipment, opened a new zone, changed the boundaries — we need to update the directory of zones and warn those who use the reports. Otherwise, an unexplained gap appears in the data, and trust is lost.
Dashboard: one screen instead of forty charts
Practical observation: the more graphs, the less often they are viewed.
The working scheme for the manager is one screen that opens in the morning in a minute:
- download now and forecast for the evening by day of the week;
- comparison of today's stream with a comparable day;
- three to four zones with the greatest deviation from the usual;
- open issues: open sessions, silent sensors, alarms per day;
- one action that the system offers: "a peak is expected at 19:00, the second administrator is at the entrance."
Everything else is in reports that are viewed once a week and once a month, and with different recipients: an operational report for the manager, an economic one for the owner, and a technical one for the maintenance service.
Checklist of system requirements
- Uploading raw events via the API, not just ready-made reports.
- A single session ID that links events, yandex. Checkout, and locks.
- Time synchronization of all subsystems from a single source.
- One zone directory for all subsystems, with versioning.
- Separation of the accounting contour and the analytics contour.
- Automatic depersonalization according to a schedule.
- The ability to find and delete all data on one subject.
- Idempotent exchange with the accounting system.
- Equipment status screen and silent sensor alert.
- A document with definitions of metrics and an indication of the main source for each.
- An understandable owner of the system on the side of the object.
- The plan of the basic measurement and the first experiment is before installation, not after.
Let's turn the data into reports that are used
Let's create a session data model, link the events to Yandex.Checkout and 1C, and create one screen that opens every morning.
- We will respond within a working day
- Let's clarify the task, the zones of the object and the restrictions
- We will propose a solution, a pilot order and an estimate
Is it more convenient in the messenger?
+79262103289Employees respond from 9:00 to 23:00 Moscow time, every day
How can we help
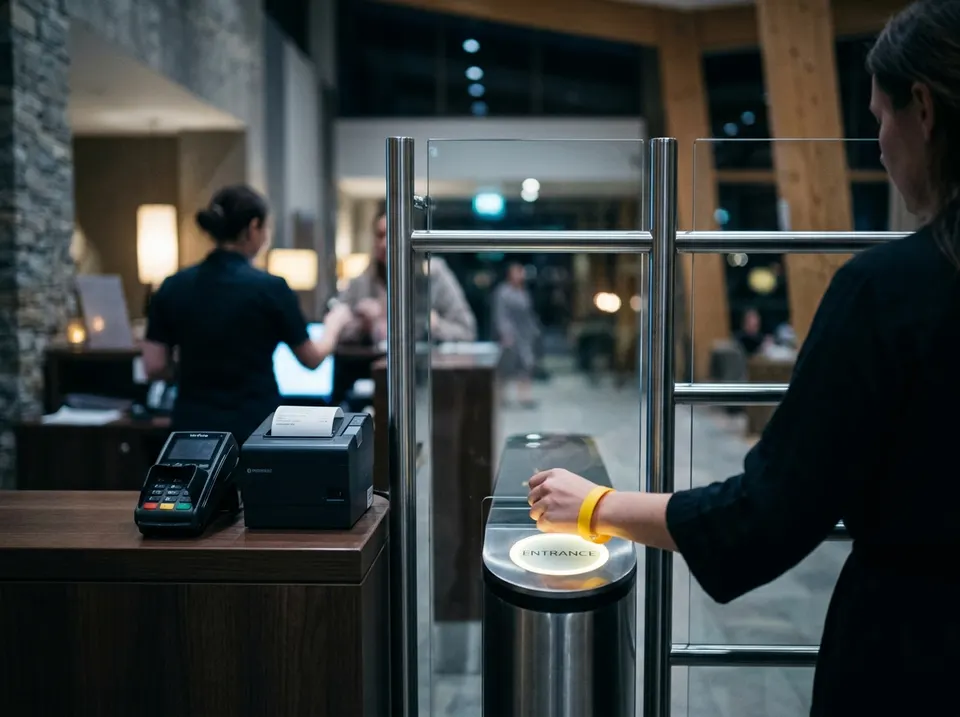
System integration
Turnstiles, ticket offices, 1C, CRM and the site begin to exchange data themselves. Employees stop transferring numbers with their hands.
1ССКУДREST APIЭквайрингIntegration of equipment taking into account
Turnstiles, wristbands, cash registers and cameras transmit data to 1C and CRM themselves: the guest has passed, the visit is written off, the revenue converges.
SigurСКУДОнлайн-кассыЭквайринг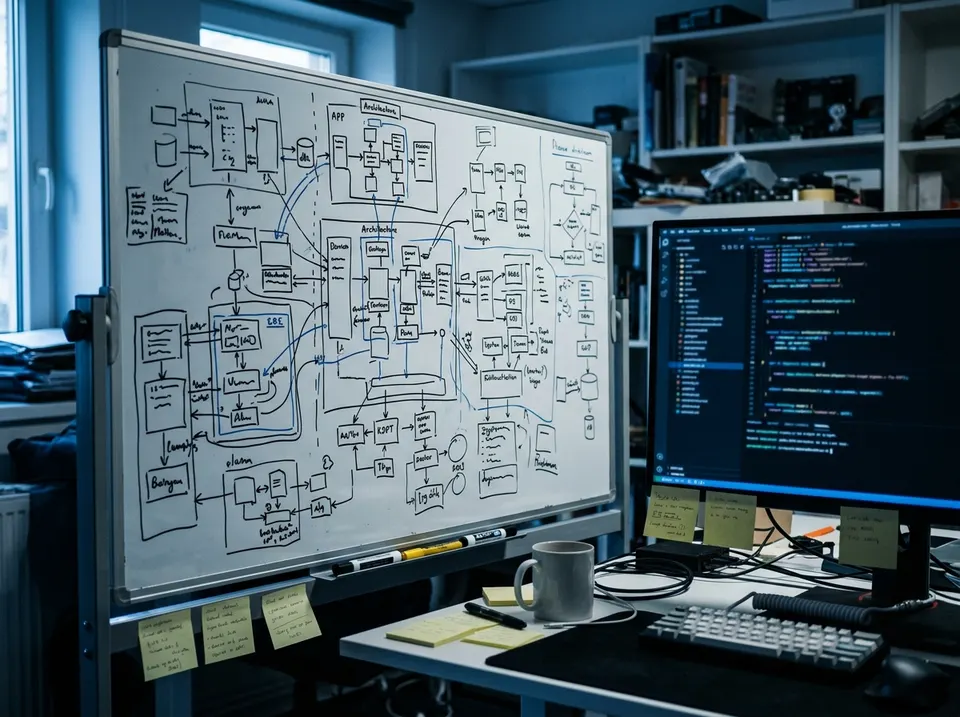
Development
When a typical program does not fit the process, and the tables no longer cope. We do it on ready-made platforms where it is reasonable, and we write from scratch where it is needed.
Веб-приложенияREST APIЛичные кабинеты1СFrequent questions
Where to start if the data is already being collected, but we don't use anything?
Starting with three steps: upload raw events from recent months, collect the session funnel (logged in → reached the main service → bought → paid extra), and select one management decision that you are ready to make based on this data. Then — the basic measurement and experiment.
How much data is needed to draw conclusions?
Depends on seasonality. For a service facility, a reasonable minimum is two to four full weekly cycles, because the guest's behavior strongly depends on the day of the week. You need to compare the same days, not "week to week".
Do I need separate storage and BI?
For a small object, an accounting database with a normal data model and several reports is sufficient. A separate analytical contour is justified for several objects or, if necessary, to store the history for years in an impersonal form.
Who should do this: an equipment supplier or an IT contractor?
The equipment supplier is responsible for ensuring that the sensors give correct events. The data model, integrations, metrics and reports are separate engineering work, and most often it is done by the one who deals with the accounting system and the site. If this part is not entrusted to anyone, it will not be done.
Is it possible to just buy ready-made analytics from a vendor?
It is possible, and for counting at the inputs it is reasonable. But as soon as the "zone and cash register", "bracelet and locker", "visit and subscription" bundles are needed, integration with your accounting system is required — and this is about your processes, not about the vendor's product.
What should I do if the two systems give different attendance figures?
Not to choose the "more correct" one, but to describe exactly what everyone thinks: the turnstile counts the aisles, the counter counts the people in the doorway, the cash register — payments, bracelets — issued carriers. These are four different values, they must differ. Assign the main source for each metric and fix the definitions.
Sources
Sources
- Conversion analytics in retail — definitions of metrics as relationships with counting in the denominator
- Heat maps and zonal analytics — the practice of building and reading maps (vendor material)
- Analysis of zonal analytics: visits versus time — a sign of a corridor versus a destination
- Review of video analytics for retail, 2026 — composition of metrics and restrictions
- Comparison of counting and employment methods, 2026 — accumulation of error in employment metrics
Other articles in the series
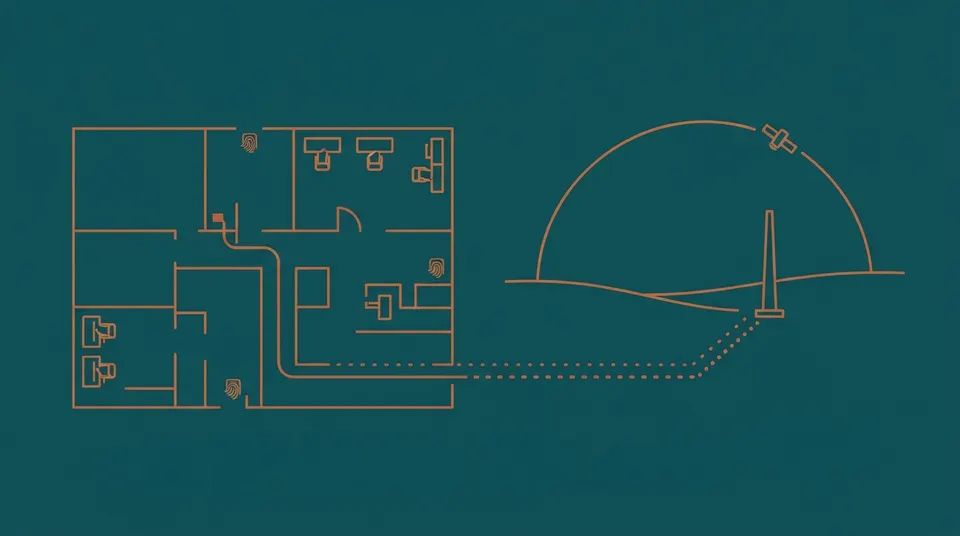
Hybrids, a guest smartphone and large open areas
In a real project, one technology almost never works — a combination works, and the only question is which one. We analyze how radio and inertial sensors are formed, why the room plan is a free source of accuracy, what the application on the guest's smartphone really gives, and how tracking is arranged in an open area: park, glamping, skiing, festival.

Law: what can and cannot be tracked in Russia
When the movement data becomes personal, which requires 152-FZ from an object with visitors, where cameras cannot be placed categorically, why "counting unique visitors" by persons is biometrics with a special regime, and what responsibility is in effect after the changes of 2025. Plus the radio frequency part: what can be set without permissions, and what can not be bought in the US version.
Comparison and selection: what to take for your task and what it will cost
The result of the series: a summary table of all tracking technologies, a selection tree, nine typical scenarios with recommended stacks, a cost of ownership structure (where cable is more expensive than equipment), a restriction bypass matrix, a pilot plan for 4-8 weeks, a checklist of technical specifications and a forecast for 2026-2028.